If you’ve ever checked your website on Google PageSpeed Insights and felt confused, you’re not alone. The report shows a lot of numbers, colors, and technical terms. But once you understand what each section means, PageSpeed Insights becomes a powerful tool to improve your website speed, user experience, and even SEO performance.
In this 2026 guide, you’ll learn how to read a PageSpeed Insights (PSI) report step by step—without getting overwhelmed.
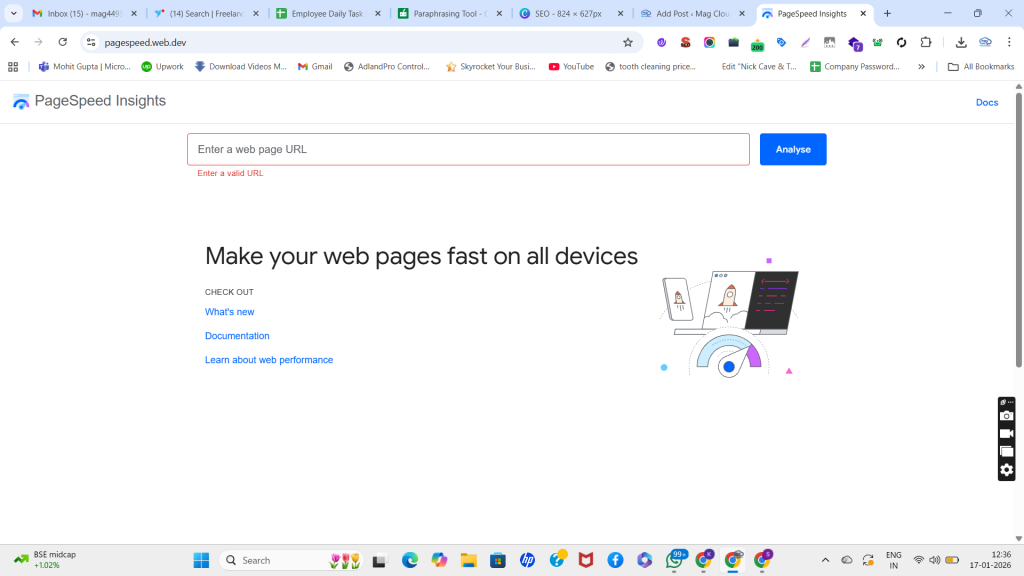
What Is PageSpeed Insights?
Google PageSpeed Insights is a free tool that analyzes your webpage and gives you performance insights for both mobile and desktop. It helps you understand how fast your page loads, how quickly it responds to user actions, and whether the layout stays stable while loading.
PSI uses two types of data: Field Data and Lab Data. Understanding the difference is the key to reading the report correctly.
Field Data vs Lab Data: The Most Important Difference
1) Field Data (Real Users)
Field data comes from real Chrome users who visited your site. Google collects this data through the Chrome User Experience Report (CrUX). It represents real-world conditions—different devices, networks, and locations.
Why it matters: Field data is closer to what Google and users actually experience. It’s also strongly connected to Core Web Vitals evaluation.
2) Lab Data (Test Environment)
Lab data is generated by Lighthouse in a controlled test environment. It simulates how your site might perform on a typical device and network.
Why it matters: Lab data helps diagnose issues and identify what exactly is slowing down your page.
If your site has low traffic, you may see “Not enough data” for field data. In that case, rely more on lab data while improving your site.
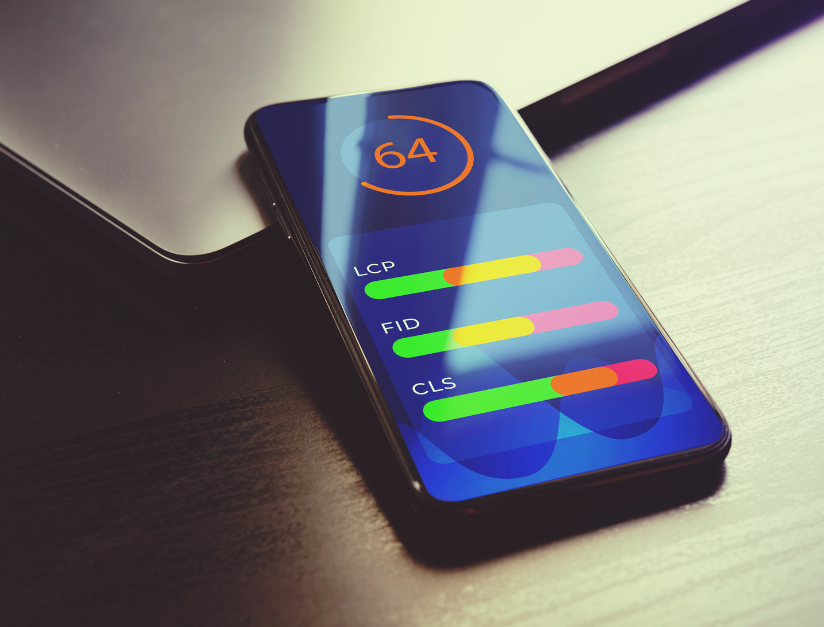
The Core Web Vitals Assessment (Pass or Fail)
At the top of the report, PSI shows whether your page passes or fails Core Web Vitals. This result is based mainly on field data.
Core Web Vitals focus on three main metrics:
- LCP (loading speed)
- INP (interaction and responsiveness)
- CLS (visual stability)
If you fail, don’t panic. It simply means there are clear improvements you can make.
Understanding the 3 Core Web Vitals Metrics
1) LCP (Largest Contentful Paint)
LCP measures how fast the main content of the page loads—usually a banner image, hero section, or main heading.
- Good: Under 2.5 seconds
- Needs Improvement: 2.5–4 seconds
- Poor: Over 4 seconds
Common LCP problems:
- Heavy hero images
- Slow server response (high TTFB)
- Render-blocking CSS/JS
Fix idea: Compress and convert images to WebP/AVIF, use caching, and reduce heavy scripts above the fold.
2) INP (Interaction to Next Paint)
INP measures how fast your page responds when someone clicks, taps, or types. In simple terms, it checks whether your website feels smooth or laggy.
- Good: Under 200 ms
- Needs Improvement: 200–500 ms
- Poor: Over 500 ms
Common INP problems:
- Too much JavaScript
- Too many WordPress plugins
- Heavy third-party scripts (chat widgets, trackers)
Fix idea: Remove unnecessary plugins, delay non-critical scripts, and reduce heavy animations.
3) CLS (Cumulative Layout Shift)
CLS measures how much your page layout shifts while loading. If buttons move or text jumps, users get annoyed and sometimes click the wrong thing.
- Good: Under 0.1
- Needs Improvement: 0.1–0.25
- Poor: Over 0.25
Common CLS problems:
- Images without width/height
- Ads/popups loading late
- Fonts causing layout changes
Fix idea: Add image dimensions, reserve space for dynamic elements, and optimize font loading.
What the Performance Score (0–100) Really Means
PSI gives a performance score from 0 to 100. This score is based on lab data, not real user data.
- 90–100: Good
- 50–89: Needs Improvement
- 0–49: Poor
Important: Don’t chase a perfect 100. Focus more on improving Core Web Vitals and real user experience.
Opportunities: Your Action List
The “Opportunities” section shows what improvements can reduce load time. It often includes suggestions like:
- Serve images in next-gen formats (WebP)
- Properly size images
- Reduce unused CSS/JavaScript
- Eliminate render-blocking resources
- Enable text compression
Best practice: Start with the opportunities that save the most time in milliseconds.
Diagnostics: Hidden Issues You Shouldn’t Ignore
Diagnostics highlight deeper technical issues such as:
- Reduce main-thread work
- Minimize third-party usage
- Avoid long tasks
- Improve server response time
- Prevent layout shifts
Think of Diagnostics as the “why” behind the low score. It’s extremely useful for developers and SEO teams.
The Correct Priority Order (Fix This First)
If you want faster results, follow this order:
- Fix LCP first (images + caching + server speed)
- Fix INP second (reduce JavaScript and heavy scripts)
- Fix CLS last (layout stability and fonts)
This approach improves both user experience and Core Web Vitals faster.
Final Thoughts
PageSpeed Insights is not just a speed tool—it’s a roadmap for better user experience and stronger SEO. When you understand field data vs lab data, focus on LCP, INP, and CLS, and fix the biggest issues first, your website becomes faster, smoother, and more trusted by users and search engines.
If you want, share your PSI results (LCP/INP/CLS + top opportunities), and I’ll suggest a safe, step-by-step improvement plan for your website.

FAQs
1) What is Google PageSpeed Insights?
PageSpeed Insights (PSI) is a free Google tool that analyzes a webpage’s performance on mobile and desktop and shows speed metrics, Core Web Vitals, and improvement suggestions.
2) What is the difference between Field Data and Lab Data in PSI?
Field Data comes from real users (CrUX) and reflects real-world performance. Lab Data is a Lighthouse simulation used to diagnose issues and test improvements.
3) Why does my PageSpeed Insights report say “Not enough data”?
This happens when your page doesn’t have enough real-user traffic for CrUX field data. You can still use lab data to improve performance.
4) What are Core Web Vitals in PageSpeed Insights?
Core Web Vitals are three key UX metrics: LCP (loading), INP (interactivity), and CLS (stability). They help measure how users experience your site.
5) What does LCP mean and how do I improve it?
LCP measures how fast the main content loads. Improve it by optimizing hero images, using caching/CDN, and reducing render-blocking CSS/JS.
6) What does INP mean and how do I improve it?
INP measures how quickly your site responds to clicks and actions. Improve it by reducing heavy JavaScript, removing unnecessary plugins, and delaying third-party scripts.
7) What does CLS mean and how do I improve it?
CLS measures layout shifts while loading. Reduce it by adding image dimensions, reserving space for dynamic sections, and optimizing font loading.
8) What does the performance score (0–100) actually mean?
The score is based on lab data (Lighthouse simulation). It’s useful for debugging, but real-user field data and Core Web Vitals are more important for long-term SEO and UX.
9) What are “Opportunities” in PageSpeed Insights?
Opportunities are recommended improvements that can reduce load time, like image optimization, removing unused CSS/JS, and eliminating render-blocking resources.
10) What should I fix first if my PSI score is low?
Fix in this order: LCP first, then INP, then CLS. Start with the highest time-saving opportunities and test after each change.